Village
Log in Request a demo

The AI research agent workspace for investors

Hire teams of AI research analysts. Answer questions at scale.

Analyze the impact of changes to bonus depreciation in the Trump tax bill on Hormel Foods
Analyze the impact of changes to bonus depreciation in the Trump tax bill on CVX
Analyze the impact of changes to bonus depreciation in the Trump tax bill on GM
Analyze the impact of changes to bonus depreciation in the Trump tax bill on Rivian
Analyze the impact of changes to bonus depreciation in the Trump tax bill on Tesla
Analyze the impact of changes to bonus depreciation in the Trump tax bill on Ford
Analyze the impact of changes to bonus depreciation in the Trump tax bill on Tesla
Analyze the impact of changes to bonus depreciation in the Trump tax bill on General Mills
Analyze the impact of changes to bonus depreciation in the Trump tax bill on Tyson Foods
AI that gets the details right at every scale

“Genuinely feel like Village solves key AGI problems—continual learning and long-term memory—right in the research workflow.”

PM at leading endowment

“99% of funds would find this transformative. We ran this across 1,200 filings. The analyst time reduction was immediate and obvious.”

Trader at $50B+ AUM fund

“Check out what it’s doing in the latest legal analysis. Marvelous! So cool—definitely the best tool for research.”

Associate at top distressed-credit fund

Enabled by our unique approach to financial research.

Assistants live in a shared workspace, read documents, update tables, and use tools—like browsing EDGAR and the web—exactly as you do.

Unique approach screenshot

Best-in-class autonomy

  • Assistants run until the job is done — whether it’s 10 minutes or 10 hours

  • Scores highest in accuracy for public-company research (Vals AI)

56%
Perplexity
80%
Deep Research
92%
Village

Accuracy based on benchmark questions over SEC EDGAR and web (Vals AI, 2025)

Total transparency.

Shared task logs you can use to audit the research plan
Task log window
Full history of every document created, filing read, and search performed
History window
A complete timeline of the assistant’s tabs, reasoning, and steps
Timeline window

Use cases

Read every document,challenge every assumption,scale your best ideas.

Track KPIs alongside commentary

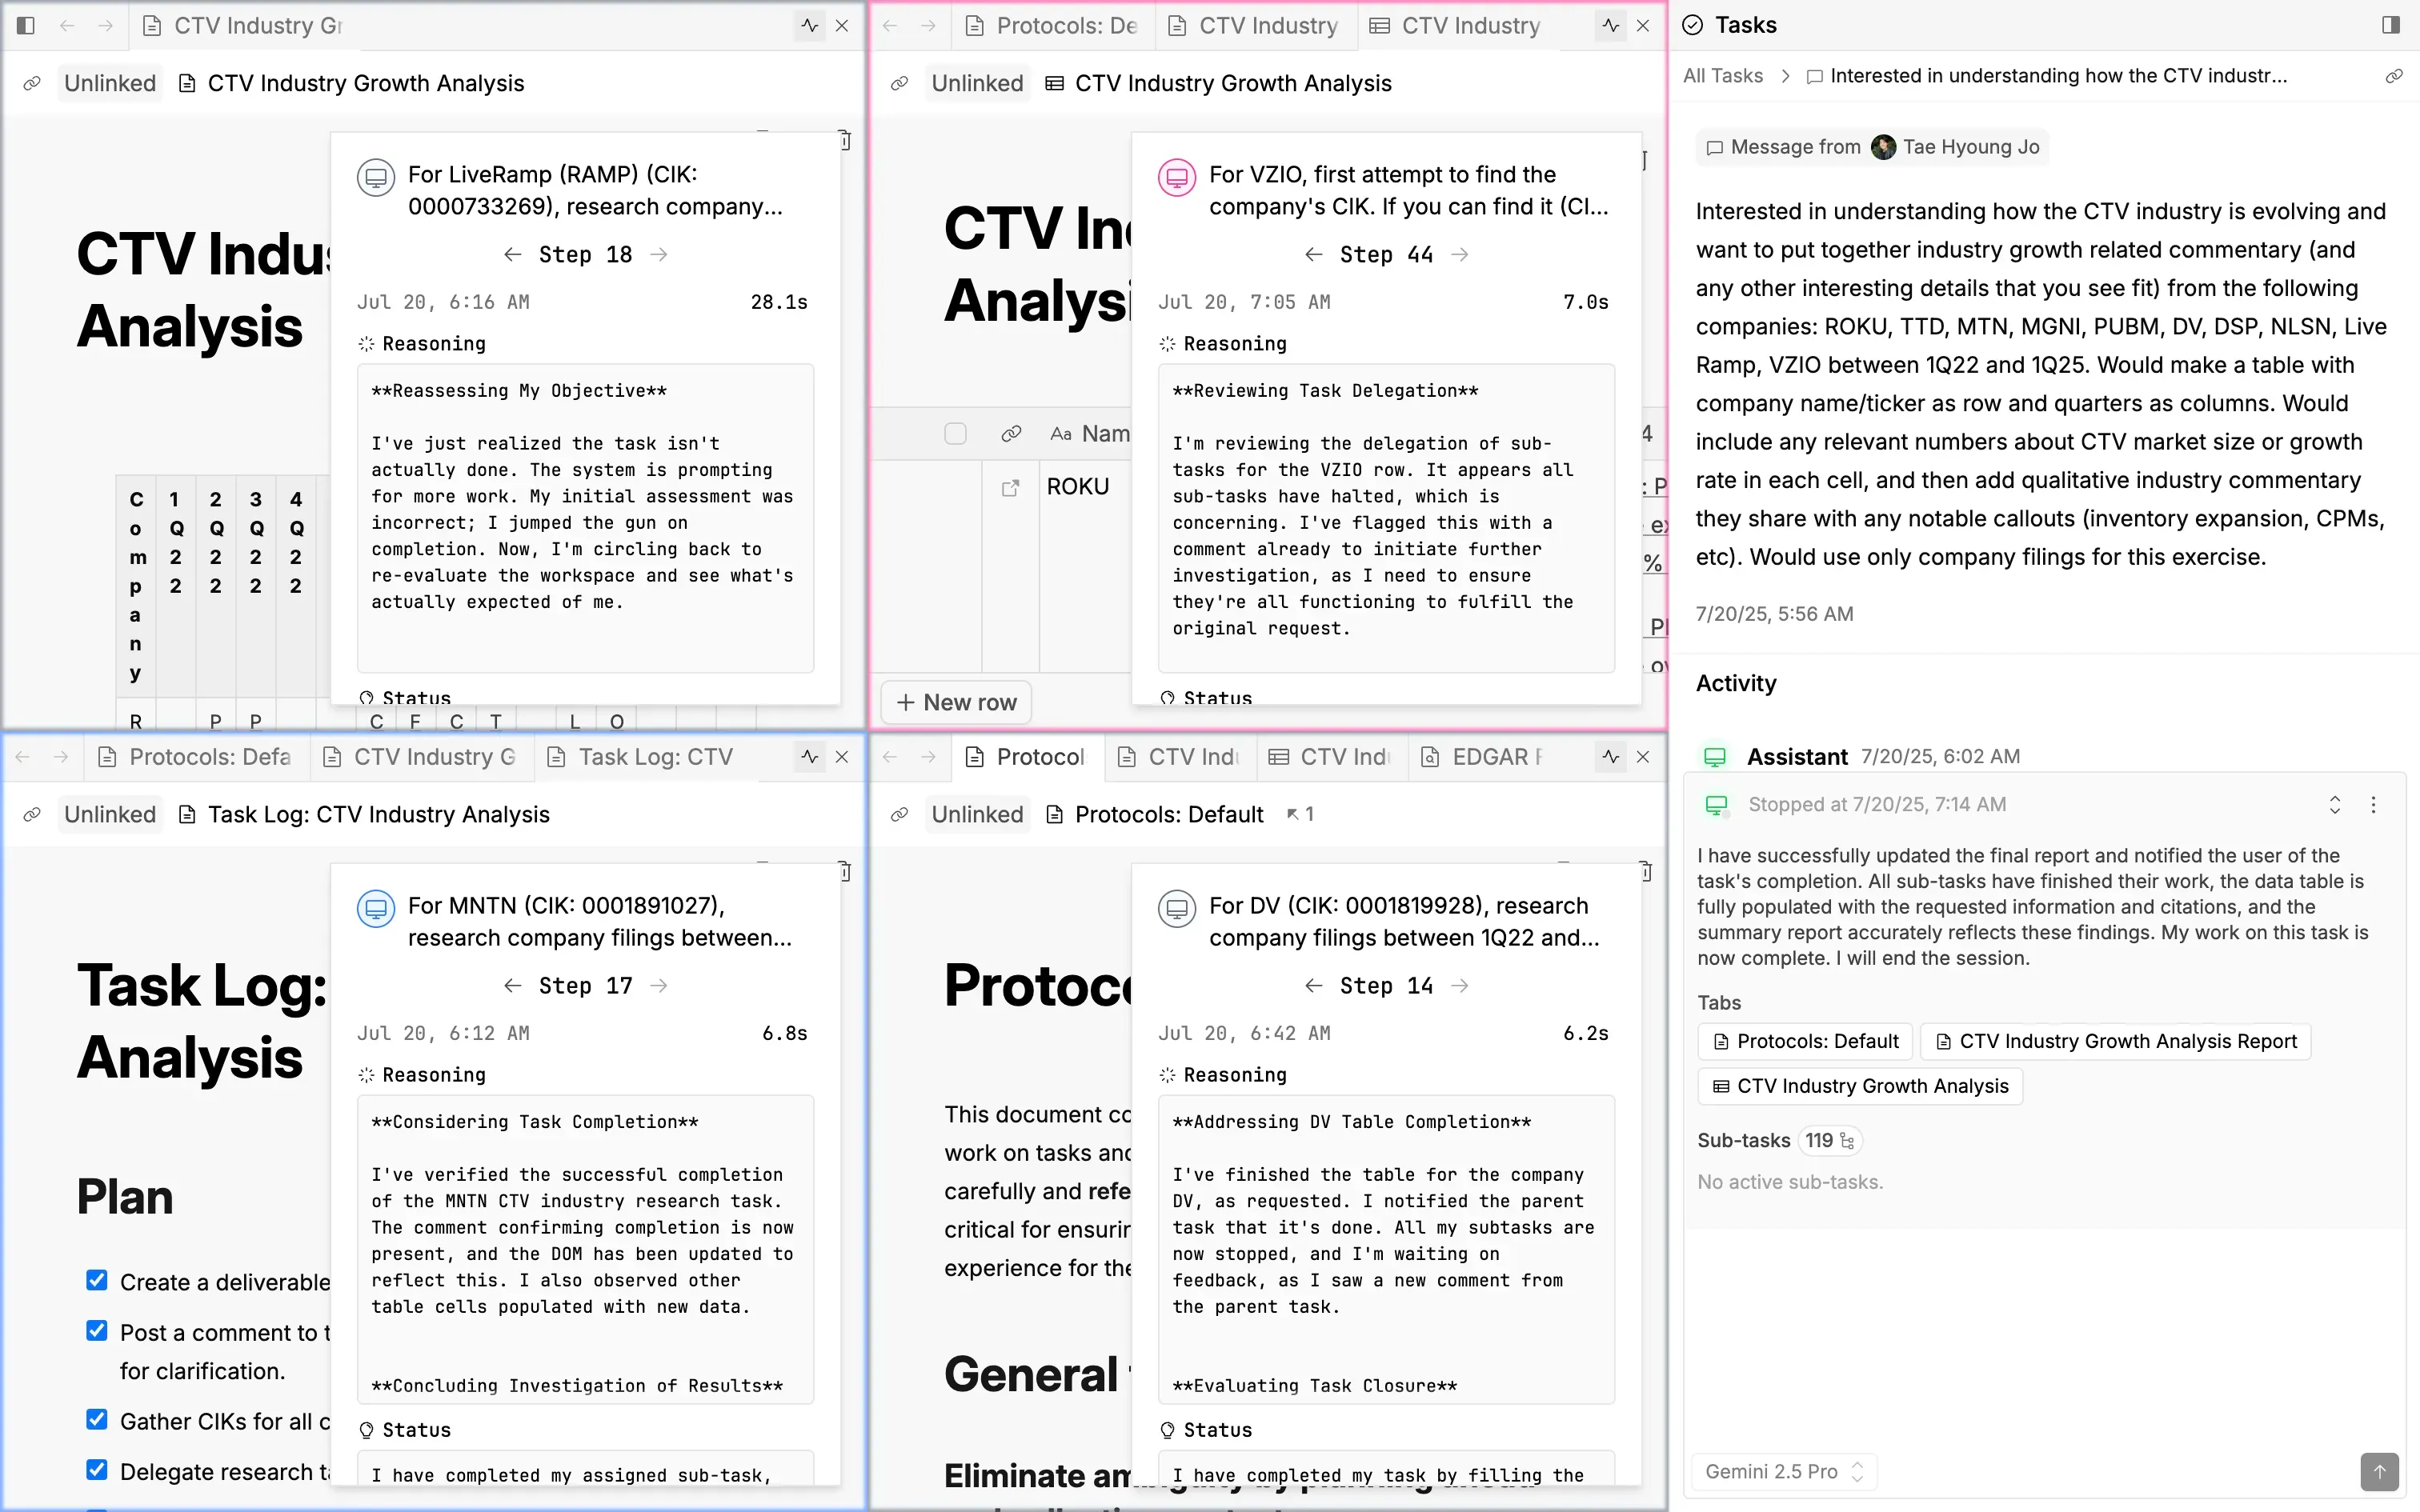
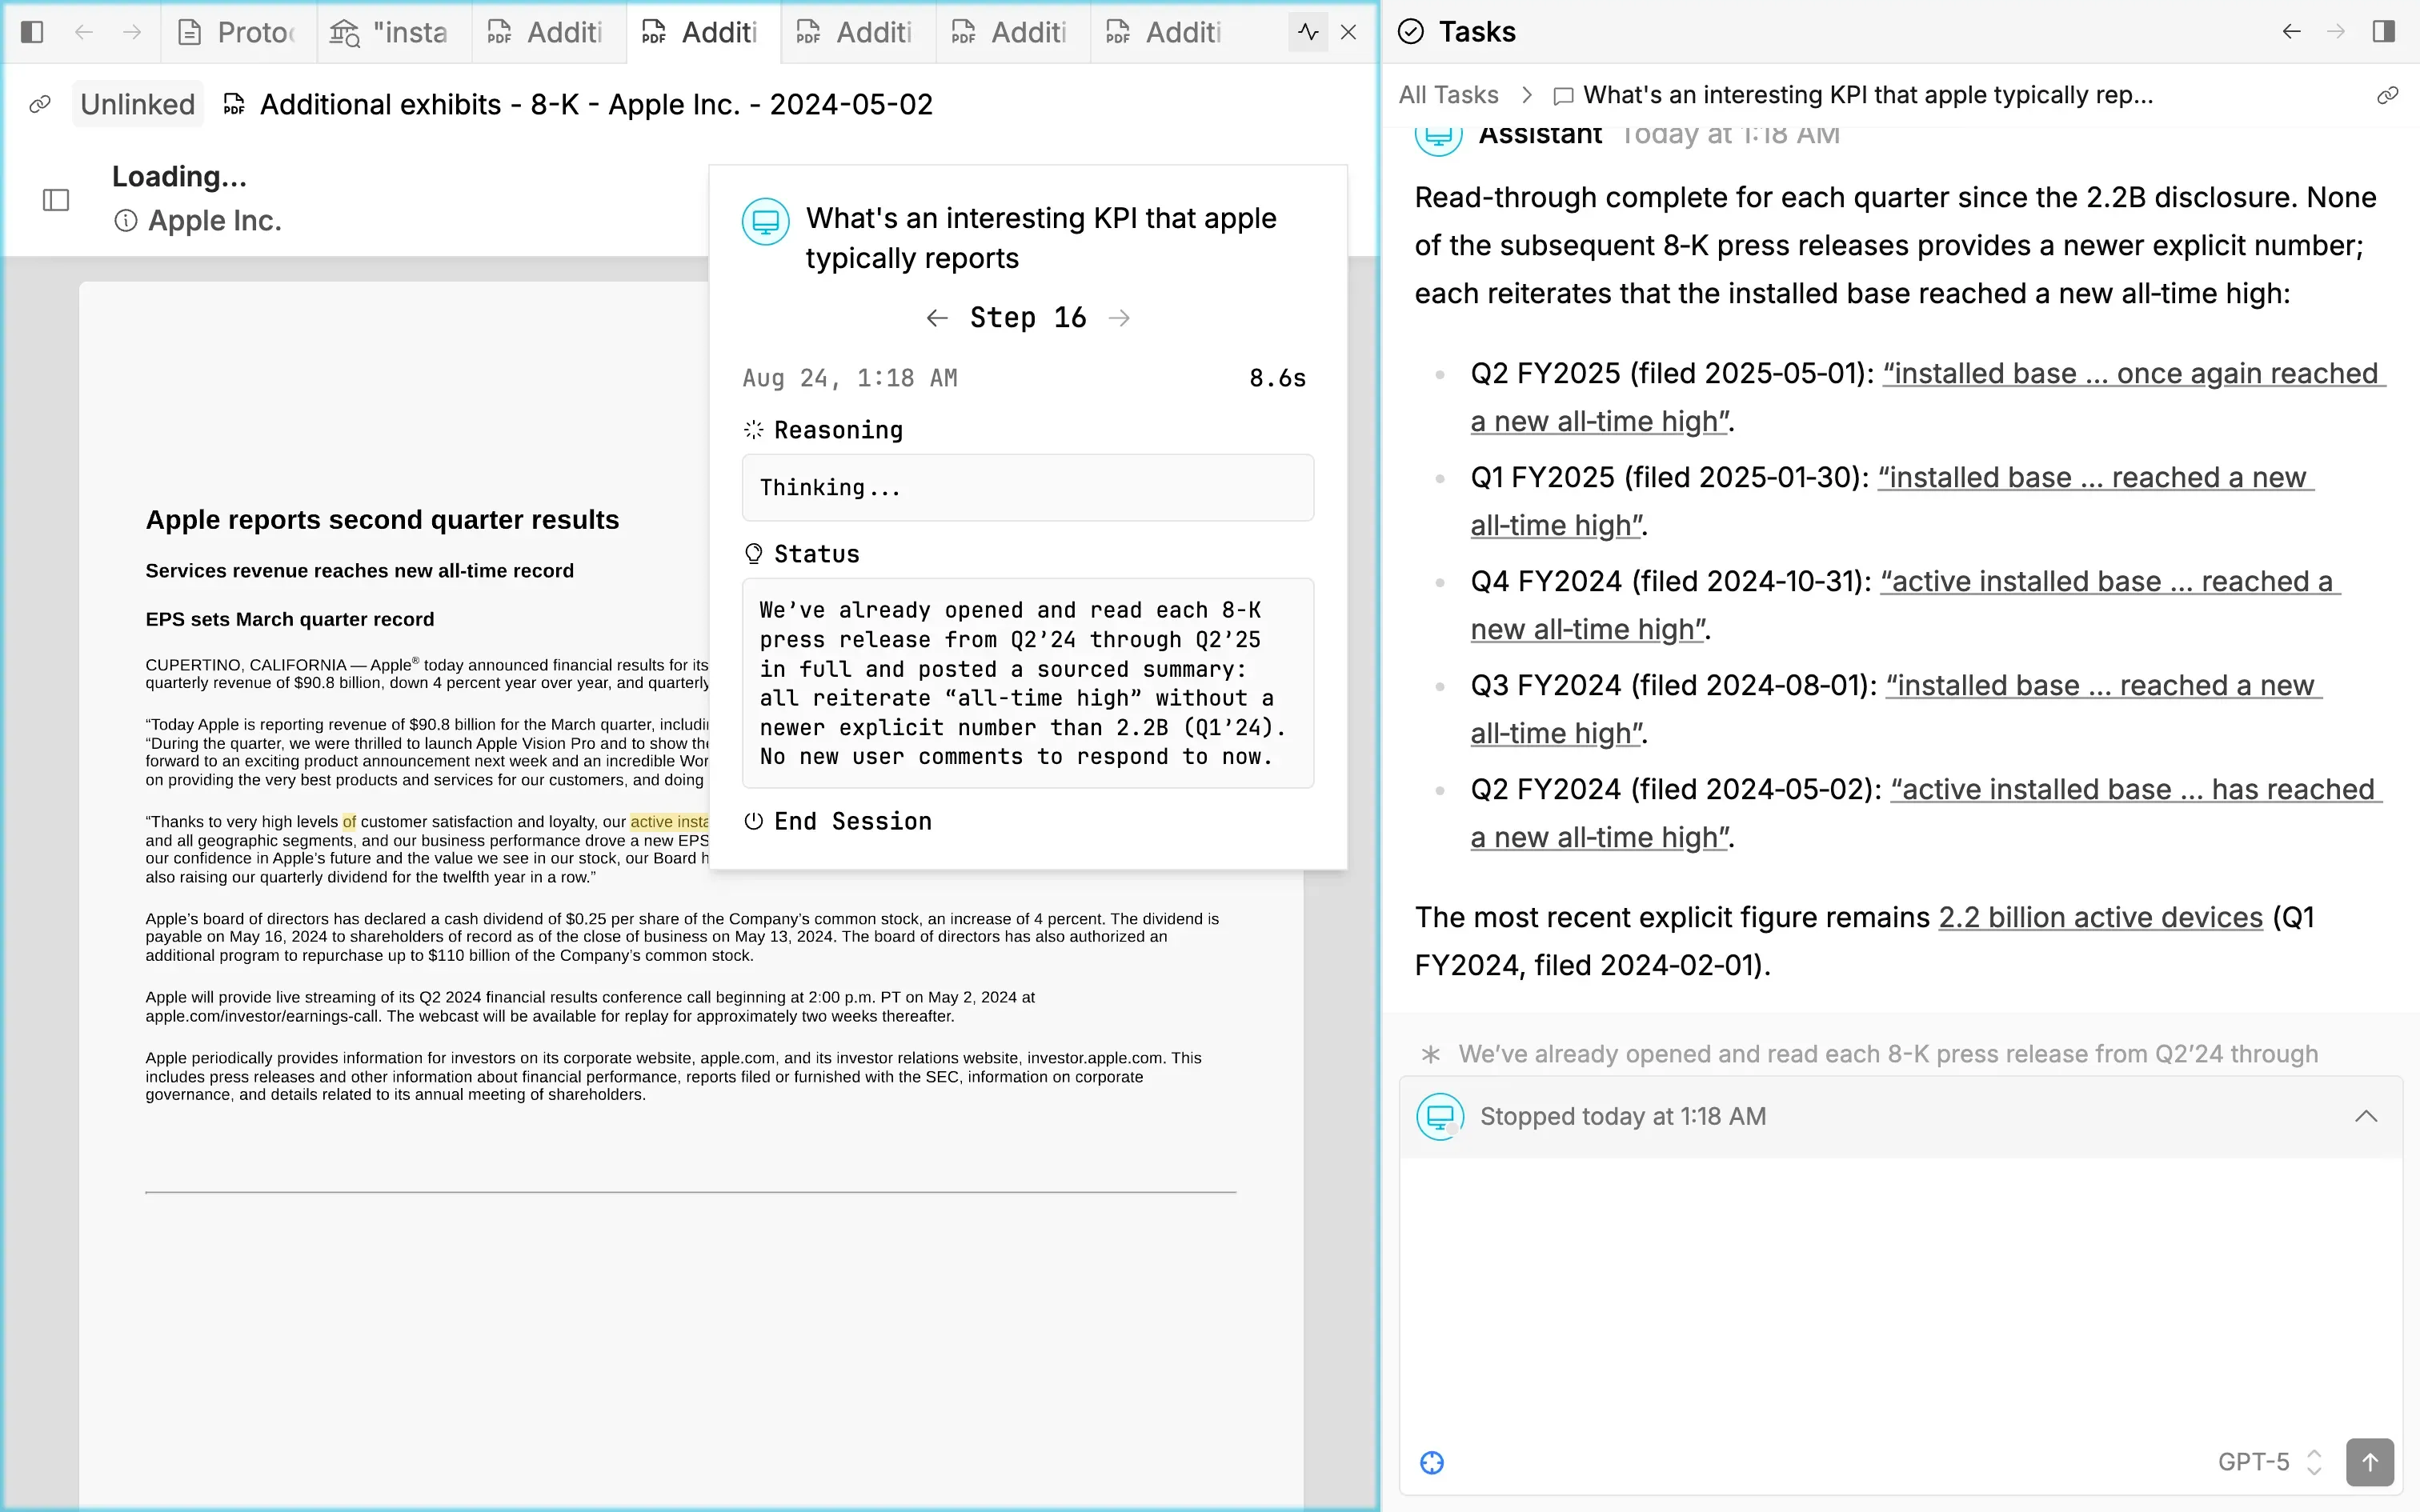
Extract hard-to-find KPIs with context across an entire industry.

Understand management’s tone

Comprehensively track the evolution of management’s thinking.

Never miss a headline

Monitor every press release and news site for developments that are material to your coverage.

Covenant analysis project

Lay out every debt basket with verbatim text and plain-language interpretation in parallel columns.

Management tone over time

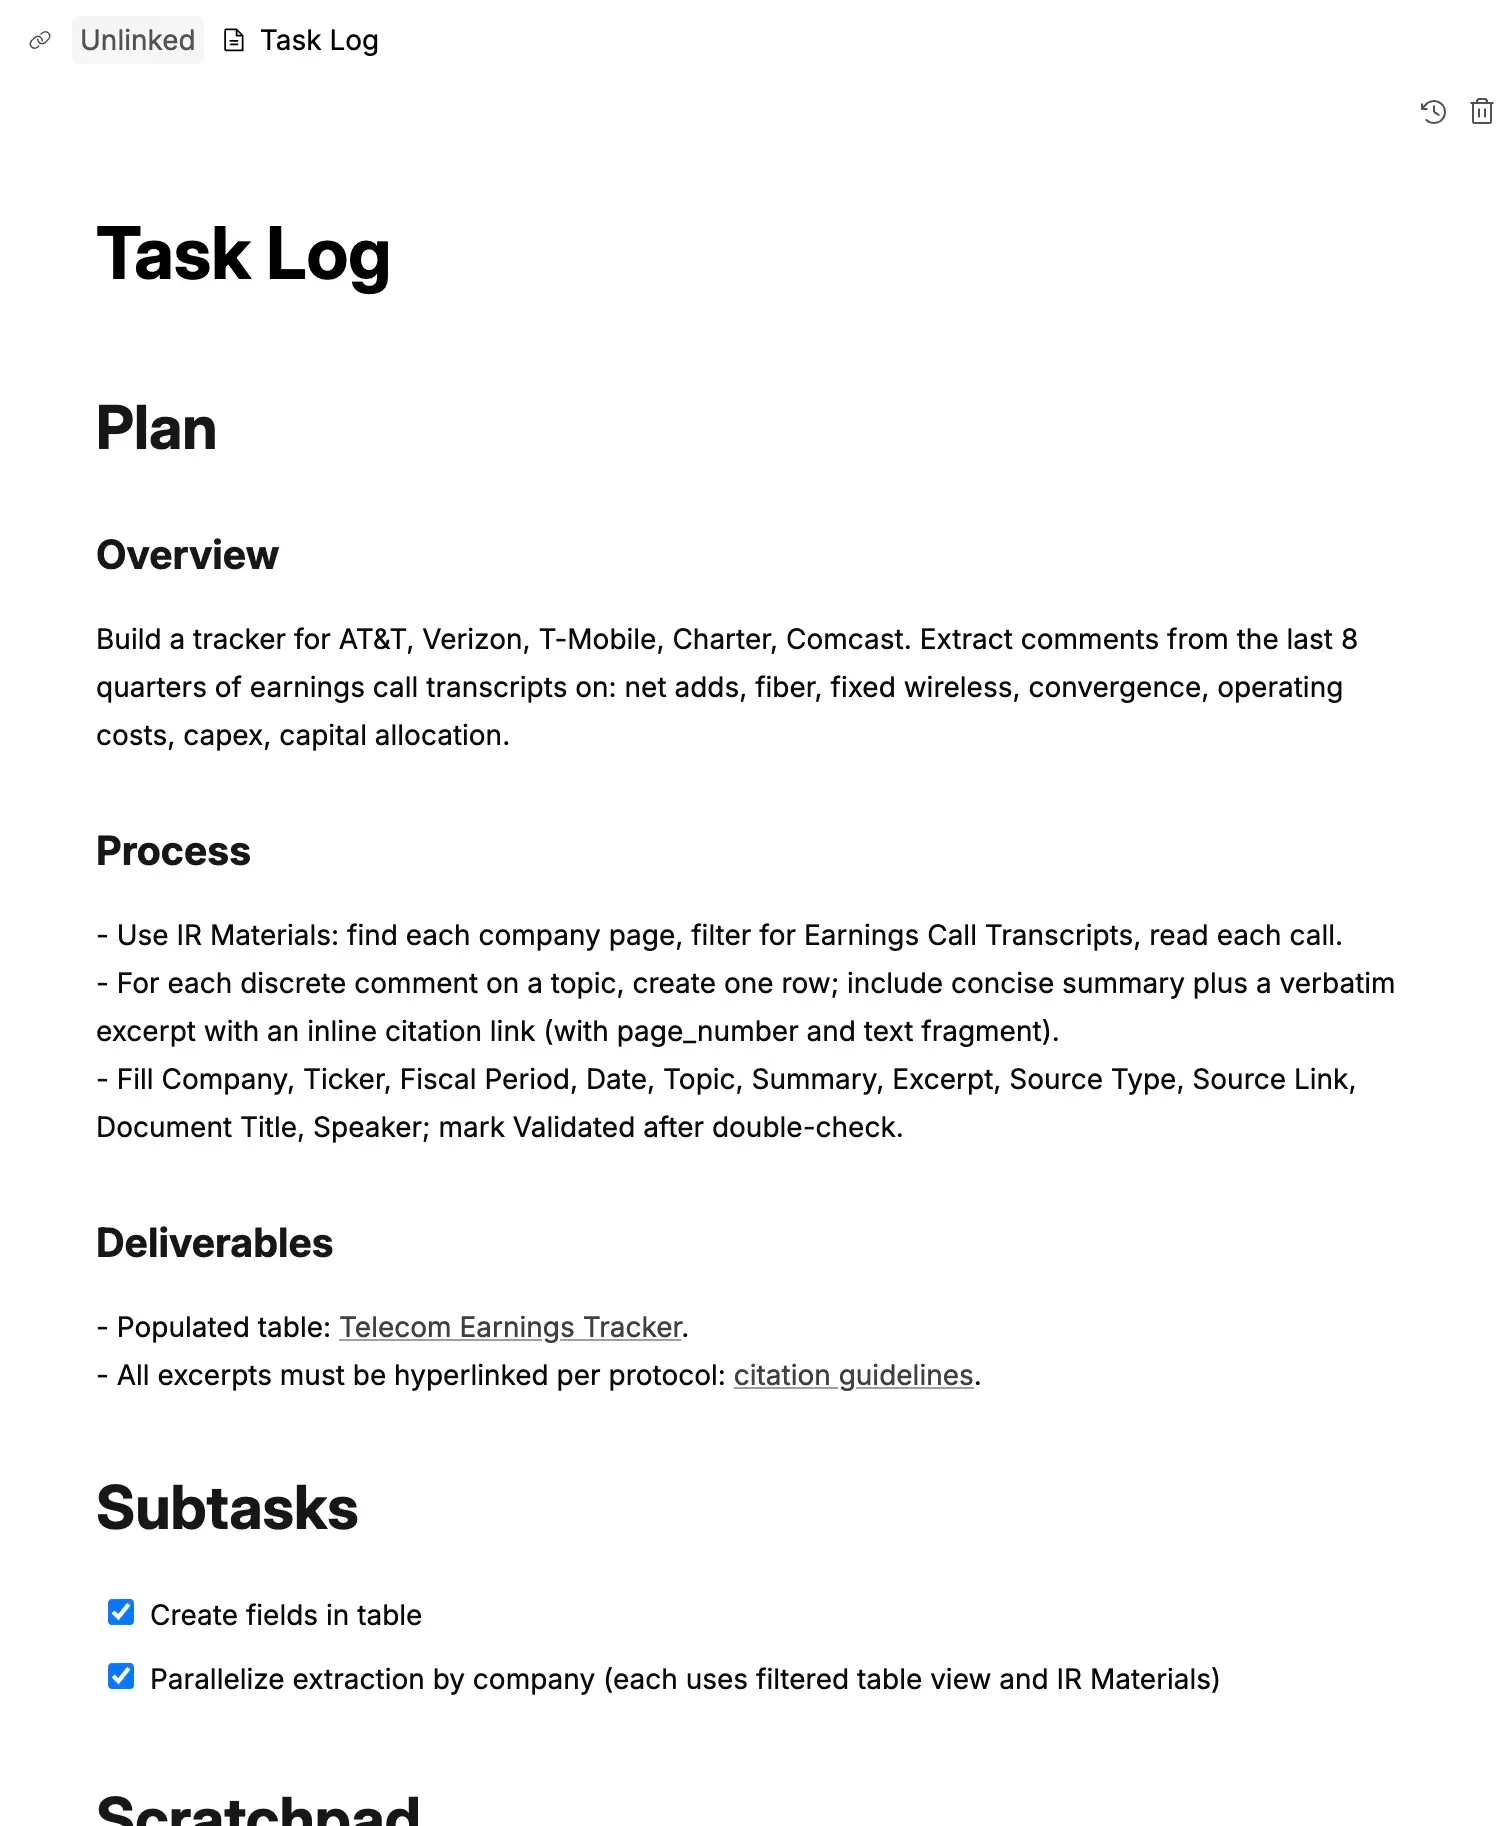
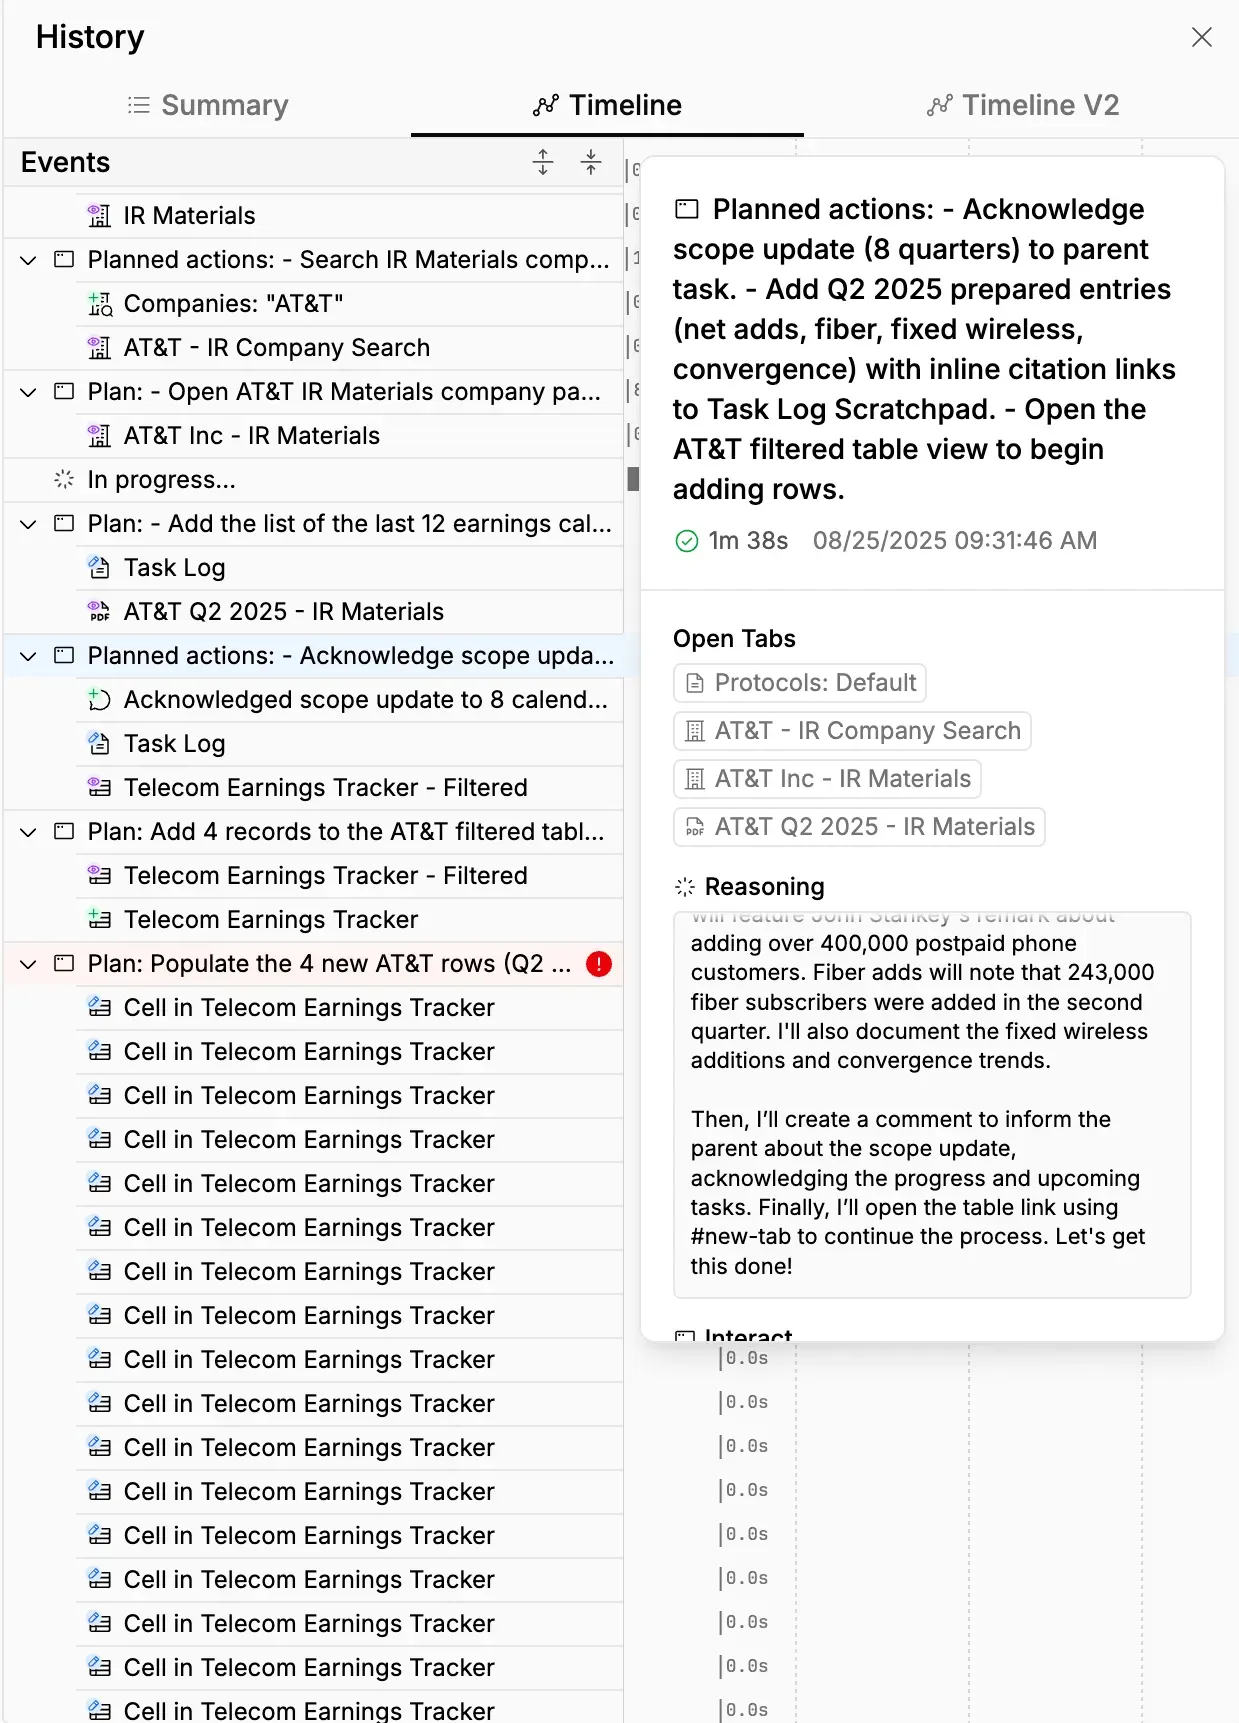
Track how leaders discuss growth drivers across 8 quarters; flag shifts in sentiment and guidance.

KPI table for theaters

Attendance, ATP, F&B per patron, U.S. box office revenue — by chain and quarter.

Disclosure comp for UBER/CART

Pull commentary across 12 quarters of filings and earnings materials; extract relevant passages.

100+ more use cases

  • Industry read-throughs
  • Supply chain impact analysis
  • Debt covenant analysis
  • Bottoms-up market sizing

Real work requires a structured approach.

Assistants create dozens of research documents and bubble up the most important information to the user.

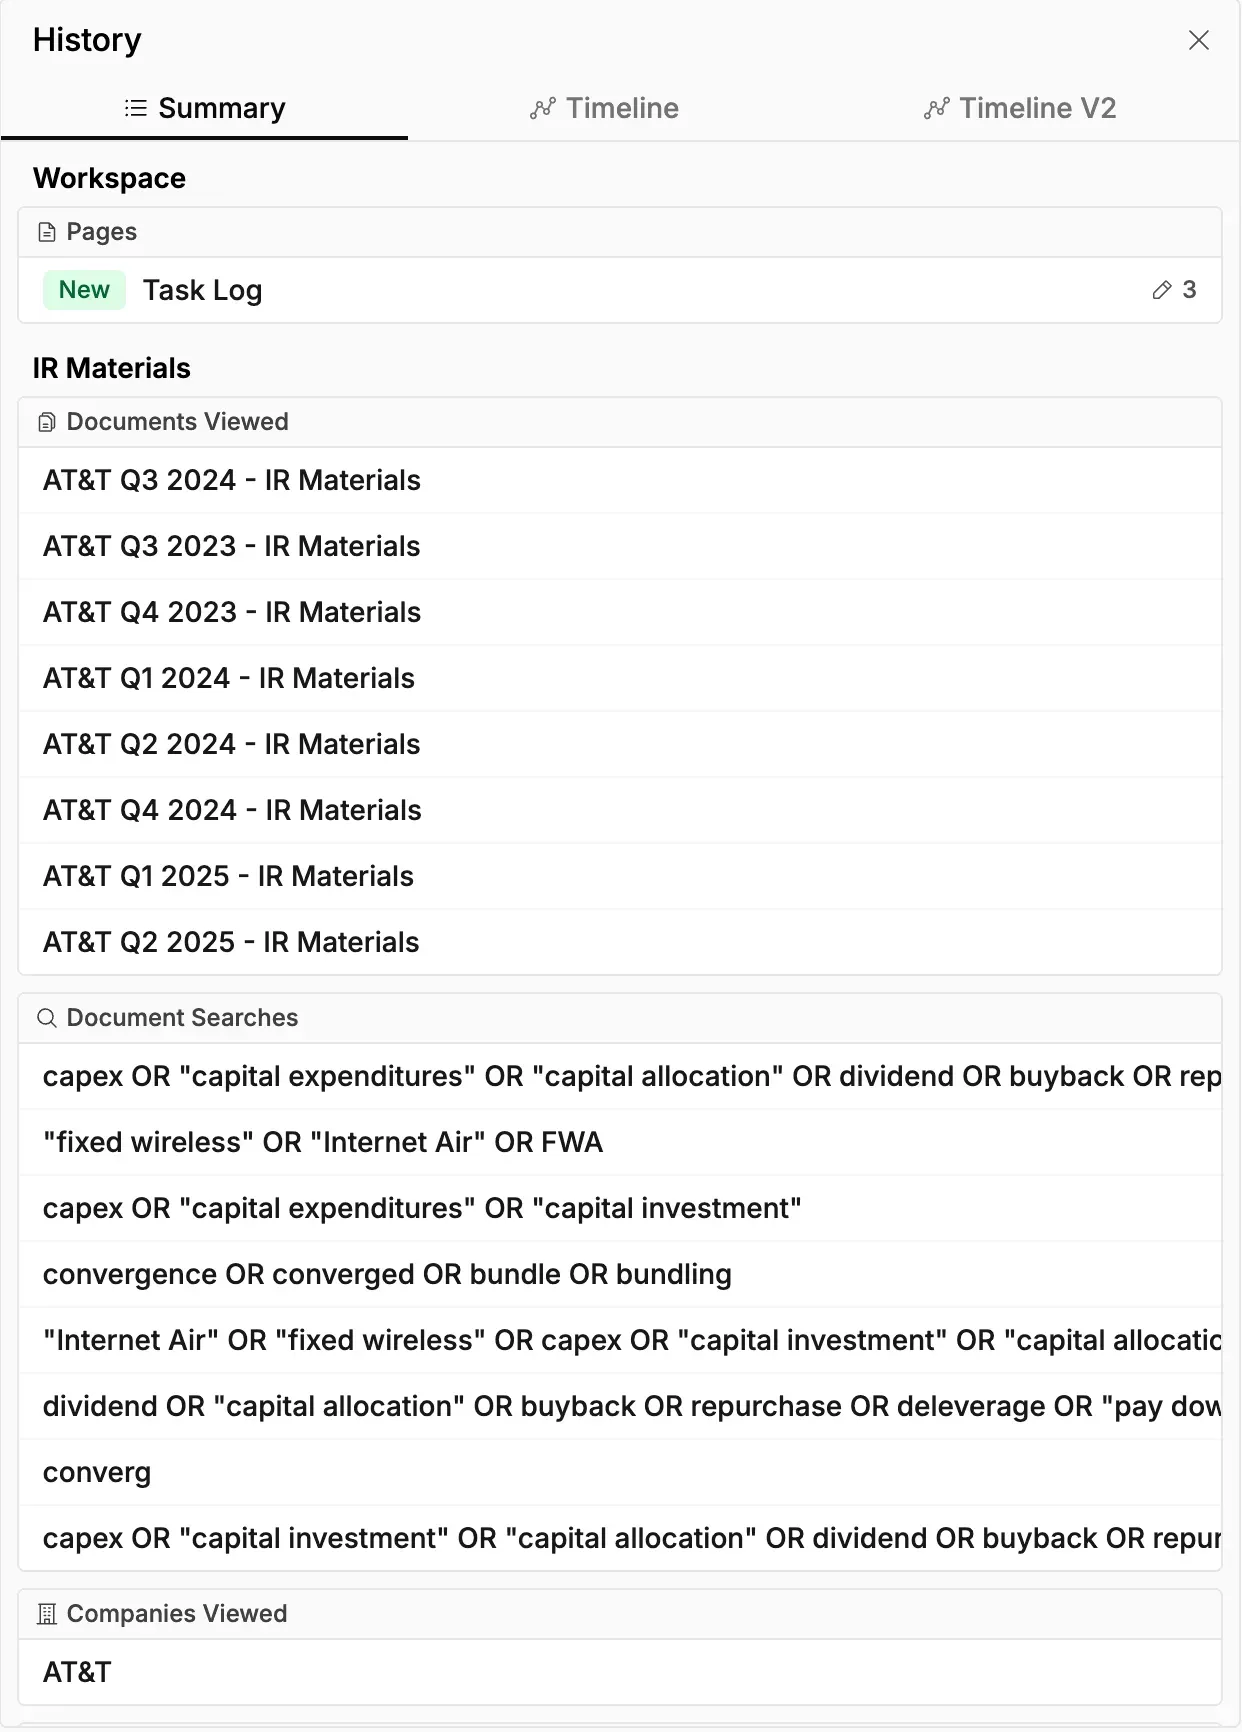
Have confidence that every document was read—and zoom in on the details whenever you need more information.

Assistant Today at 11:18 AM

Quick status: Core pages are ready for review with disclosure-only citations.

  • Compilation: UBER and CART Disclosures — for DoorDash Analysis
  • Uber: main | Ads (Q3'22–Q4'23, Q1'24–Q2'25) | Delivery (Q3'22–Q4'23) | Grocery (Q3'22–Q4'23, Q1'24–Q2'25) | Definitions: link
  • Instacart: main — Ads % of GTV Q3'23–Q2'25 seeded; profitability bullets added; definitions added (GTV, Adjusted EBITDA, margin).
  • DoorDash definitions (for comparison): link

Decision: For Uber, if Ads % of GB/GOV isn’t explicitly disclosed, should I compute implied % via Interpreter with step-by-step math and citations?

Subtask: Uber — Disclosures (Last 12 Quarters)

Task Log

Plan

Goal: Extract verbatim disclosures from Uber for the last 12 quarters (Q3'2022-Q2'2025) across filings (10-Ks, 10-Qs, 8-K earnings press releases via EDGAR) and IR materials (earnings call transcripts, investor presentations via IR Materials). Organize by topic and chronologically. Topics: (1) Uber Eats Food Delivery profitability, (2) Uber Eats Grocery profitability, (3) Uber Advertising incl. % of GB/GOV and profitability, (4) Definitions and metrics. Deliver a Page titled "Uber — Disclosures (Last 12 Quarters)" with Summary and topic sections.

Uber — Disclosures (Last 12 Quarters)

Summary

  • Ads (Q1'24–Q2'25): subpage complete — link.
  • Grocery (Q1'24–Q2'25): subpage complete — link.
  • Ads (Q3'22–Q4'23): in progress — link.
  • Delivery (Q3'22–Q4'23): subpage complete — link.
  • Delivery (Q1'24–Q2'25): subpage active — link.
  • Definitions & Metrics: in progress — link.

Subtask: Instacart / Maplebear (CART) — Disclosures (Last 12 Quarters)

Task Log

Plan

Extract verbatim disclosures for Instacart/Maplebear (CART) over the last 12 quarters (Q3'2022-Q2'2025) across: Profitability, Ads (% of GTV/GOV and profitability), Grocery Delivery profitability, and Definitions. Sources: EDGAR (10-K, 10-Q, 8-K earnings PR; S-1/S-1/A for pre-IPO) and IR materials (shareholder letters, presentations, call transcripts). Strictly follow citation protocol with text fragments and page_number.

Instacart (CART) — Disclosures (Last 12 Quarters)

Summary

  • Ads & other investment rate ranged 2.6%–3.1% of GTV; Q2'2025 was 2.8% (range evidenced by Q1'2024 2.6% and Q4'2024 3.1%).

Profitability

Verbatim disclosures listed chronologically (Q3'2022 → Q2'2025). Annotate each with period and source (e.g., "Q1'2024 Shareholder Letter").

  • Q3'2022 — GAAP gross profit represented 6.9% of GTV and 73% of total revenue (Q3'2023 Shareholder Letter via 8-K, prior-year comparison).
  • Q4'2022 — GAAP gross profit represented 7.8% of GTV and 76% of total revenue (Q4'2023 Shareholder Letter via 8-K, prior-year comparison).
  • Q1'2023 — GAAP gross profit represented 7.8% of GTV and 77% of total revenue (Q1'2024 Shareholder Letter via 8-K, prior-year comparison).
  • Q1'2023 — GAAP net income of $128 million; 1.7% of GTV and 17% of total revenue (Q1'2024 Shareholder Letter via 8-K, comparative chart).

Subtask: DoorDash (DASH) — Definitions and Metric Basis

Task Log

Plan

Extract verbatim definitions and metric methodologies from DoorDash (DASH) filings over the last 12 quarters (Q3'2022-Q2'2025) for comparative analysis. Focus areas: (1) GOV/GTV definitions and inclusions/exclusions, (2) Take rate and monetization metrics, (3) Revenue recognition methodology, (4) Advertising revenue definitions and measurement basis. Sources: EDGAR filings (10-K, 10-Q, 8-K) and investor materials. Ensure strict citation protocol with exact text fragments and source attribution for cross-platform metric comparison with Uber and Instacart.

DoorDash (DASH) — Definitions and Metrics

GOV/GTV (definition and inclusions/exclusions)

  • "We define Marketplace GOV as the total dollar value of orders completed on our Marketplaces, including taxes, tips, and any applicable consumer fees, including membership fees related to DashPass and Wolt+." — Q2'2022 10-Q.
  • "Marketplace orders include orders completed through Pickup and DoorDash for Work." — Q2'2022 10-Q.
  • "Marketplace GOV does not include the dollar value of orders, taxes and tips, or fees charged to merchants, for orders fulfilled through Drive, Storefront, or Bbot." — Q2'2022 10-Q.
  • "We define Marketplace GOV as the total dollar value of orders completed on our Marketplaces..." / "...Marketplace GOV does not include the dollar value of orders, taxes and tips, or fees charged to merchants, for orders fulfilled through our Commerce Platform." — Q2'2025 10-Q.

Take rate/Monetization

  • "We define Net Revenue Margin as revenue expressed as a percentage of Marketplace GOV." — Q2'2025 10-Q.
  • "Our revenue therefore reflects commissions charged to partner merchants and fees charged to consumers less (i) Dasher payout and (ii) refunds, credits, and promotions..." — Q2'2022 10-Q.

What would you do with 1,000 research analysts?

Thousand analysts screenshot
Case study: Tracking telecom earnings

400+ rows of commentary in one hour.

Follow passage-level citations for every excerpt, sort and filter the output table by company or commentary type, and remix the assistant’s research.

Set up an earnings tracker table for major telecom companies: AT&T, VZ, TMUS, CHTR, CMCSA. Review historical earnings calls and pull comments about net adds, fiber, fixed wireless, convergence, operating costs, capex, and capital allocation.
Telecom tracker screenshot

Deeper, broader, more collaborative.

Feature comparison across products
Village ChatGPT Claude Finance Perplexity for Finance AlphaSense Grid
Chat with the assistant
Dedicated EDGAR integration
Earnings calls
Build on prior work Limited Limited
Granular citations
Ability to work at scale Limited
Transparent reasoning
Give feedback at scale
Collaborate with users on artifacts
Vals AI performance 96% 82% 56%
Context window Functionally unlimited 128K 200K 32K

Explore what unbounded intelligence can do for your firm.

Request a demo