The data-center backlash hasn’t slowed construction. It’s sped up.
The AI buildout is usually measured in chip sales and tech companies’ capital budgets. The Census Bureau measures something more physical: each month it estimates how much is spent building U.S. data centers, meaning the structures, cooling and wiring rather than the servers inside. Our Village monitor tracks that series every month. This spring, the buildings started going up much faster.
Spending has surged since March
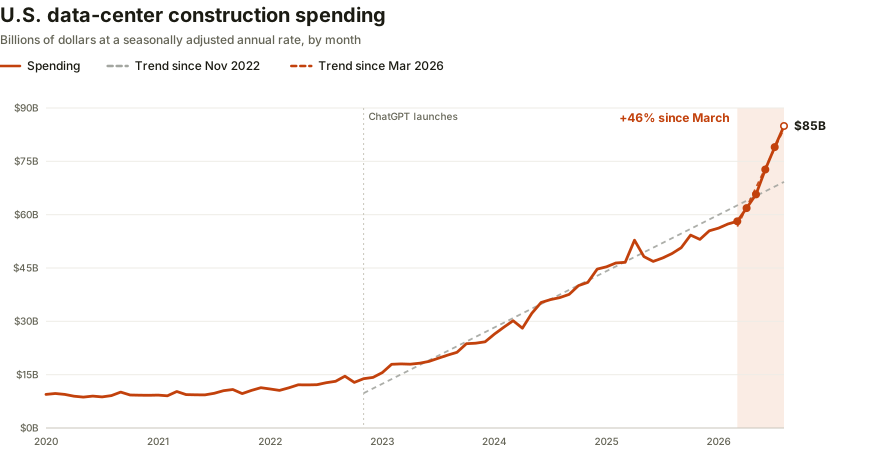
- Two years’ worth of growth in five months. Spending rose $27 billion from March to August, about as much as in the previous two years combined.
- The pace roughly quadrupled. Since March, spending has risen about $5.5 billion a month, against $1.3 billion a month in the years after ChatGPT launched.
- It followed a slowdown. Year-over-year growth had cooled to 24% early this year, the slowest since early 2022, before climbing back to 73% in August.
June and July brought the two largest monthly increases since the Census Bureau began reporting data centers separately in 2014, and August was close behind.
The revisions point up, not down
The Census Bureau estimates each month’s spending more than once. The first estimate comes out about a month after the month ends and is marked preliminary. The next two monthly releases revise it as late survey responses arrive. Each July, the Census Bureau revises the past few years again with fuller annual data and updated seasonal adjustments. New projects can also enter the survey late, which matters in a category growing this quickly.
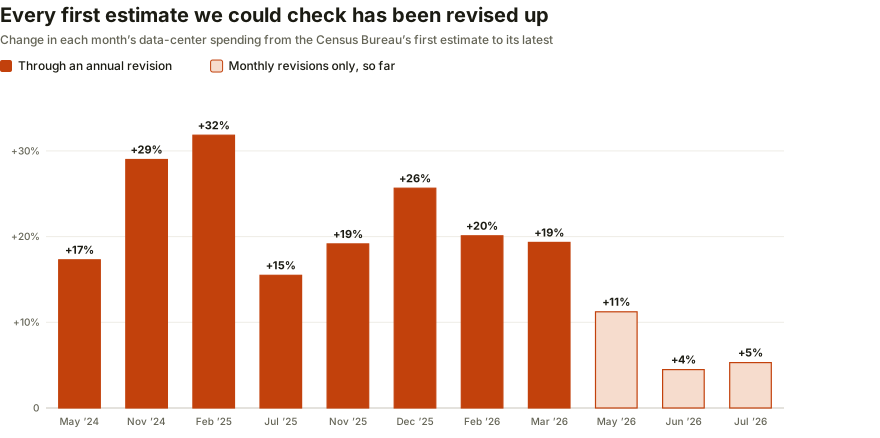
The chart above compares each month’s first estimate with its latest.
- Every first estimate we could check has been revised up. Months that have been through an annual revision rose 15% to 32%.
- The surge is probably understated. March has already been revised up 19%, while August is still a first estimate.
The Census Bureau will revise August in November and December, and again next July. If it follows the pattern of the past two years, the jump since March will look bigger, not smaller.
How we built this
This study draws on a Village monitor that our agent built on the Census Bureau’s monthly construction spending survey. Data-center spending is the Census Bureau’s private data-center category, in nominal dollars at a seasonally adjusted annual rate; it covers buildings, not the equipment inside. Trend lines are straight-line fits over the stated months. Earlier releases come from the Internet Archive’s copies of the Census Bureau’s workbooks; revisions are compared before seasonal adjustment, which the Census Bureau re-estimates each year. The data runs through August 2026, released October 1.