
Waymo’s California rides nearly doubled. Its cars still drive 2.7 miles without a passenger for every ride.
Any company that carries the public in self-driving cars in California needs a permit from the California Public Utilities Commission, which regulates passenger services in the state, and must file quarterly reports with the commission. The reports log every ride request, whether it was completed and whether the rider paid. They also log how far the cars drove, with and without riders. Empty miles are the driving with no rider aboard: on the way to a pickup or between rides. Waymo, Alphabet’s self-driving car company, gave 99.2% of the driverless rides in the latest reports, which cover April through June 2026; nearly all the rest were free rides in Amazon-owned Zoox’s pilot program. California is Waymo’s largest market, so these reports are the most detailed public record of how its robotaxi business is growing and how efficiently its cars run.
Ride growth slowed in 2026, but rides still nearly doubled from a year earlier
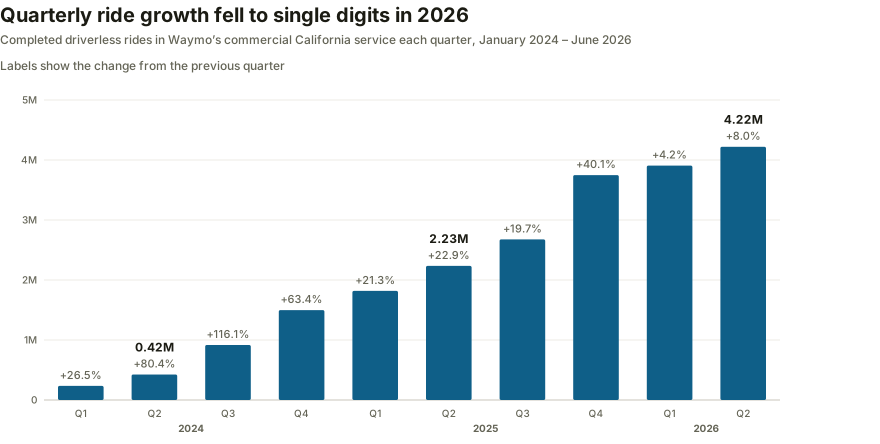
- Paid rides grew almost as fast. They rose 87.0% from a year earlier.
- Growth slowed sharply in 2026. Quarter-to-quarter growth fell from 40% at the end of 2025 to single digits.
- Daily rides peaked in April. By June they were about 5% lower.
The reports don’t say what caused the slowdown, and they don’t separate demand from the number of cars on the road, service interruptions, changes to service areas or prices. The year-over-year comparison also starts from a weak month: June 2025 was unusually slow, the month Waymo suspended service in parts of Los Angeles and San Francisco during protests. Leaving out June in both years, rides still grew 74%, and across the full first half they doubled.
Empty miles per ride stopped falling in mid-2025
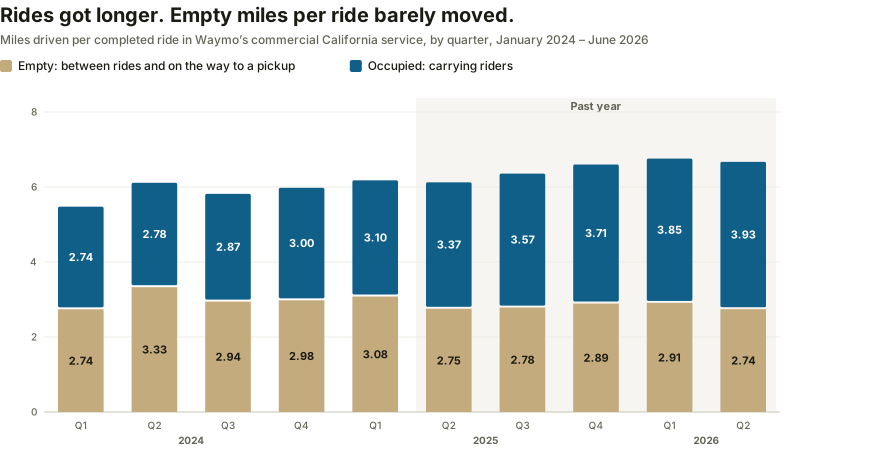
- Empty miles per ride were flat over the year. Waymo’s cars drove 2.74 empty miles for each completed ride in April–June 2026, against 2.75 a year earlier.
- Rides got longer. The average ride was 16.5% longer than a year earlier.
- Empty miles per ride fell earlier. They are 17.7% below their April–June 2024 high, and almost all of that drop happened by mid-2025.
Cars in a busier service area usually have less distance to cover to reach the next rider, so this is one place growth would be expected to pay off. The share of all driving done empty did fall over the year, from 44.9% to 41.1%, but only because rides got longer; at last year’s ride length, it would have barely moved.
Waymo’s driving grew faster in California than in Phoenix or Austin
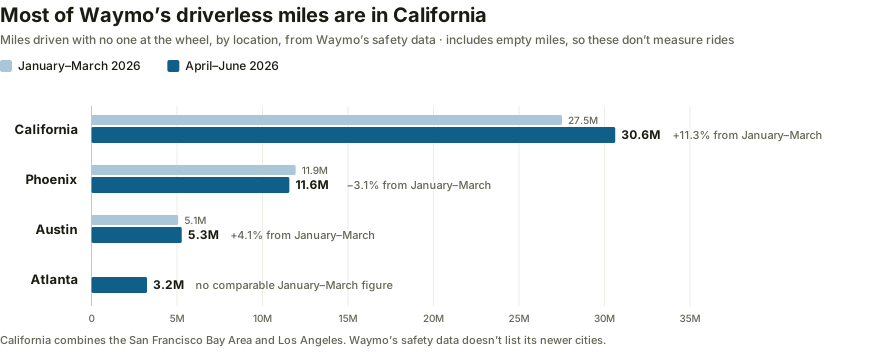
- Waymo drove 11.3% more miles in California than the quarter before, faster growth than in Phoenix or Austin.
- California accounts for most of the miles Waymo reports. The Bay Area and Los Angeles made up 60.4% of the driverless miles in Waymo’s safety data for April–June.
- Most of Waymo’s 2025 rides were in California too. Its California reports add up to about 70% of all the rides it reported giving that year.
These mileage figures come from Waymo’s own safety data and count every mile its cars drove without a human driver, including empty miles and driving outside the commission’s passenger reports, so they can’t be turned into ride counts by city. They cover five locations, not newer cities such as Miami and Dallas, and Atlanta has no comparable earlier quarter, so they can’t show whether growth is moving to those cities. In the second quarter, growth wasn’t moving from California to Phoenix or Austin.
How we built this
We downloaded the quarterly reports that Waymo, Zoox and other permit holders filed with the commission through April–June 2026, the latest quarter it has posted, and rebuilt calendar quarters from their monthly totals. Quarters differ in length; adjusted for the number of days, rides grew 6.5% and 6.9% in the two latest quarters. Rides are completed trips in Waymo’s driverless deployment program, the permit that lets it charge fares. Empty miles are the miles the commission’s data dictionary defines as driven between rides or on the way to a pickup; occupied miles run from pickup to drop-off. For the six quarters since January 2025, the monthly totals match the ride-by-ride records exactly. Market miles are the differences between Waymo’s cumulative “rider-only” mileage releases, using the three releases that share county definitions, and the comparison with Waymo’s 15 million rides in 2025 uses the total from its year-end review.
These figures are reported by the operators themselves. Commercial service includes a small share of unpaid rides, which is why we show paid-ride growth separately. Leaving out June in both years, empty miles per ride fell 2.8%. Vehicle IDs are redacted in every report since January 2025, so the reports can’t show how many cars Waymo runs or how many rides each one gives. Empty miles are an operating measure that says nothing about costs or profit, and changes in where Waymo operates can shift them. Waymo’s own ride and mileage totals cover more than these reports, so we use them only as cross-checks.