E-commerce’s competitive map: scale, specialization, and AI
WooCommerce and Shopify lead by host count; Salesforce stands out among popular sites. Sites linked to AI builders can draw product data from Shopify.

Selling online brings together businesses with very different needs. A global brand, a neighborhood shop, and an independent creator may all need a way to take payments, but the software they choose also reflects what they sell, whom they serve, and how they operate.
Those choices leave traces on public websites, which Village captures each week to help investment analysts investigate how software is used. Our September 3–4, 2026, capture covered 25.7m hosts—web addresses such as example.com or www.example.com. Alongside page content and code, the dataset records hosting information, the requests sites make as they load in a browser, and selected data returned by those requests.
Analysts can use that combination to move from a broad view of software use to the evidence at an individual site, or revisit the capture with a question that arose after collection. The Shopify connections later in this article, for example, came to light through saved requests and product responses, without another crawl.
We used this capture to look for signs of ten commerce platforms, matching the results to July’s Chrome UX Report (CrUX) popularity bands and classifying 250 selected hosts per platform. Because several hosts can belong to one business, we also checked how repeated addresses and brands affected the results.
WooCommerce led by host count, appearing on about 1.1m hosts, followed by Shopify on 869,000. Both were far ahead of the other eight platforms studied, with Squarespace Commerce third at 113,000.
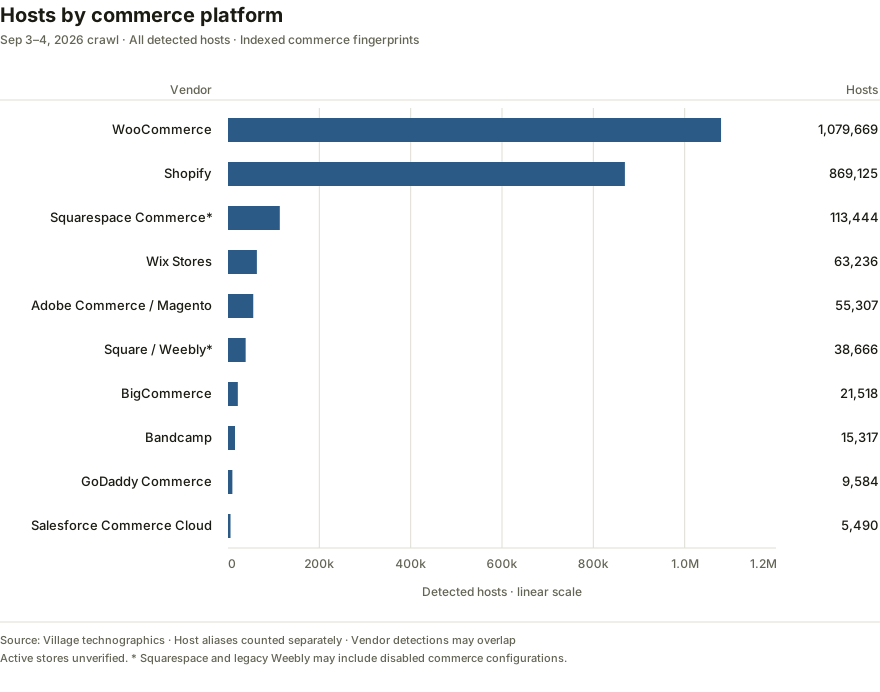
Figure 1. Hosts with signs of each commerce platform in the September 3–4 capture. The chart gives exact totals; a host can match more than one platform.
Those totals partly reflect separate counts for common address variants: treating example.com and www.example.com as one address cut Shopify’s total by 5.6% and WooCommerce’s by 5.9%. Salesforce (22.6%), Magento (18.2%), and BigCommerce (16.9%) saw larger reductions, but all ten platforms kept their places in the ranking.
Even after that adjustment, the totals describe software traces, which need not correspond to paying customers or stores taking orders. Squarespace and legacy Weebly sites can retain commerce settings when selling is disabled, while Magento’s count includes its open-source edition.
A different ranking emerges when we turn from overall scale to the most popular sites. Among hosts in the top 100,000, Shopify led the platforms studied with 1,931, compared with 685 for Magento, 595 for Salesforce, and 312 for WooCommerce.
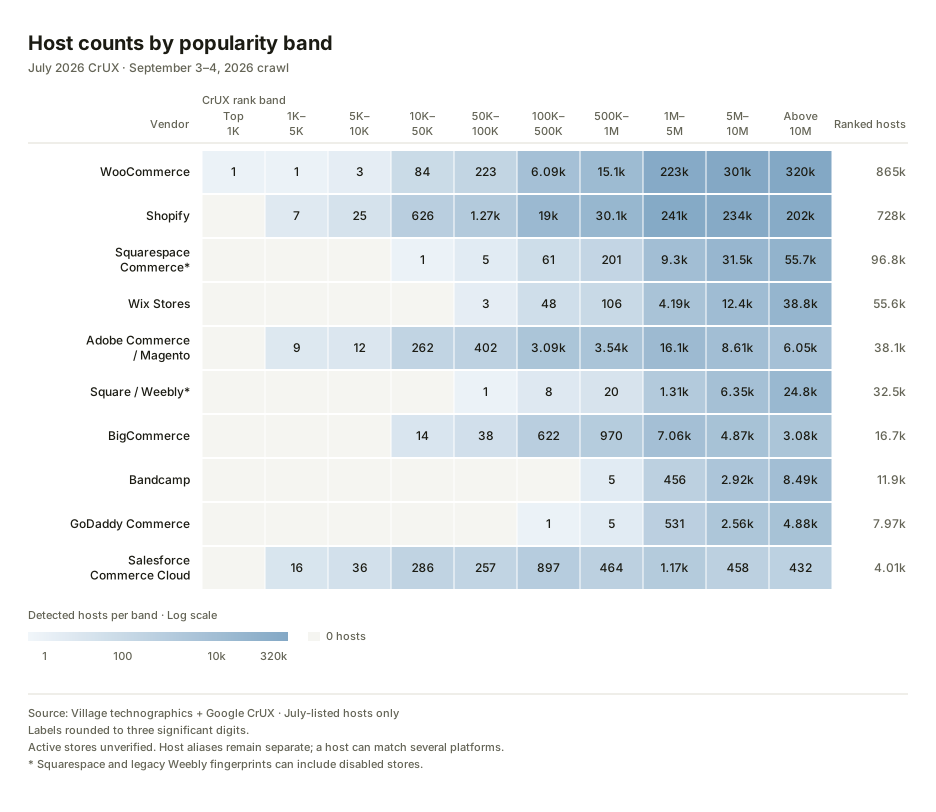
Figure 2. Host counts in July 2026 CrUX popularity bands. Each host appears in one band. Color shows counts on a logarithmic scale; hosts missing from July CrUX are excluded.
Salesforce’s position becomes clearer when we measure those counts against each platform’s total number of ranked hosts. Of its 4,014 ranked hosts, about 14.8% were in the top 100,000, compared with 1.8% for Magento, 0.27% for Shopify, and 0.04% for WooCommerce.
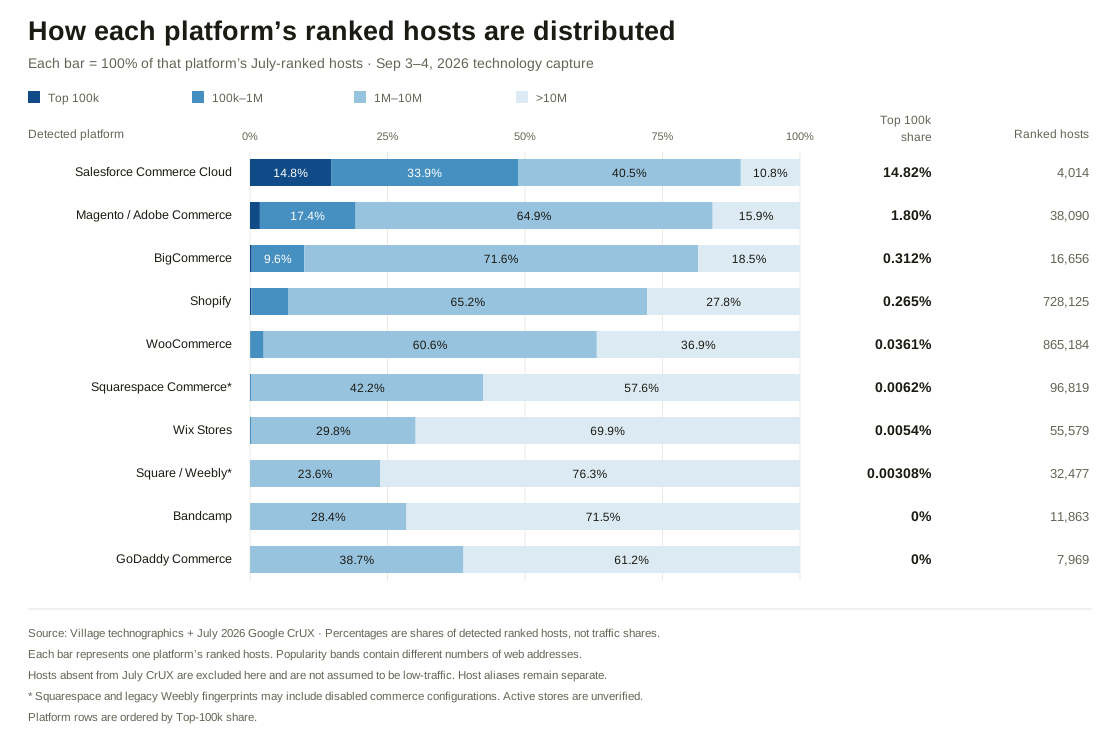
Figure 3. Each bar represents all ranked hosts for one platform and adds up to 100%. The column on the right shows the share in the top 100,000.
Shopify therefore led in the number of popular addresses, while Salesforce had a much greater concentration of them within its ranked group—a distinction that matters when comparing vendors of very different sizes. CrUX groups addresses into broad popularity bands based on visits, so these figures describe the distribution of hosts rather than their share of traffic or sales. An address absent from the catalog is not necessarily unpopular.
To understand what these platforms are used for, we looked beyond popularity to the businesses behind the addresses. Clothing stores, music catalogs, and restaurants taking reservations may all use commerce software, but they put it to different purposes.
We classified 250 hosts per platform, favoring higher popularity bands and using a fixed rule to break ties. That approach reached different cutoffs, from the 10,000–50,000 band for Shopify, Salesforce, and Magento to the 1m–5m band for Wix, Square/Weebly, GoDaddy, and Bandcamp. Because the samples favor more popular sites and reach different cutoffs, they describe the selected groups rather than each platform’s overall customer mix.
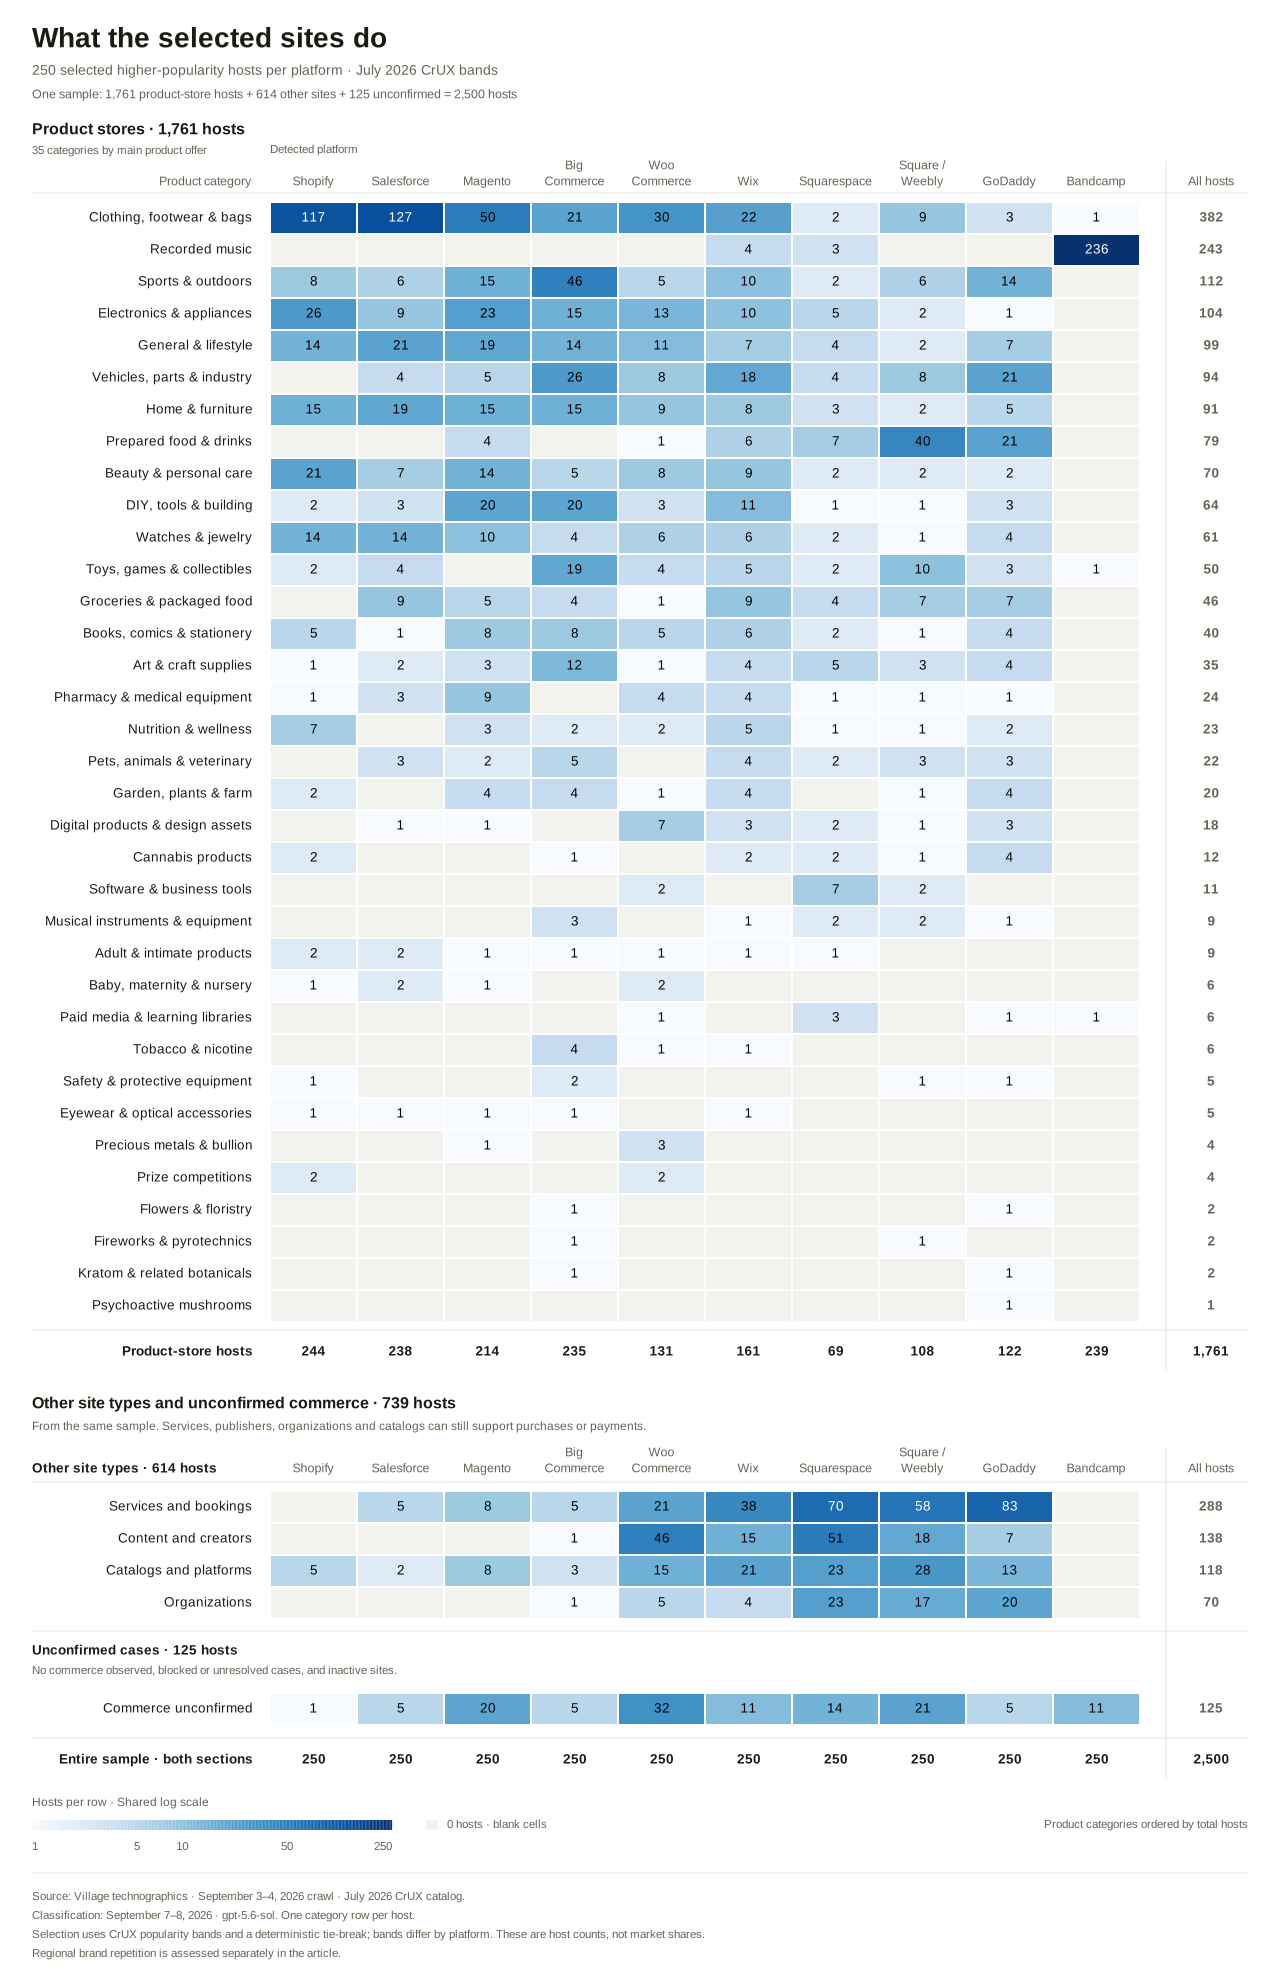
Figure 4. Site types among 2,500 selected hosts. The rows account for the full sample: 1,761 hosts in product-store categories, 614 of other site types, and 125 with unconfirmed commerce. Each host appears once.
Clothing, footwear, and bags made up nearly half of Shopify’s sample, at 117 of 250 hosts (46.8%), and just over half of Salesforce’s, at 127 (50.8%). BigCommerce’s sample was led by sports and outdoor equipment, with 46 hosts, while Bandcamp’s was overwhelmingly devoted to recorded music, with 236 of 250.
Squarespace showed a broader mix: 69 hosts in product-store categories, 70 offering services or bookings, and 51 devoted to content or creators. Services and bookings accounted for 83 GoDaddy hosts, while 40 Square/Weebly storefronts offered prepared food and drinks. The chart’s “other site types” can also support commerce through reservations, inquiries, or external services.
Repeated addresses matter here too, since one brand can occupy several places in a sample: nine of Salesforce’s home and furniture hosts were regional vidaXL sites, and six Magento hosts were regional Panini stores. Counting each of 34 reviewed brand groups once left the leading categories broadly intact, with apparel accounting for 47% of Shopify’s sample and 50.5% of Salesforce’s, and sports and outdoors for 19% of BigCommerce’s. Some smaller categories shifted more, as the checks below show.
The same storefront can also draw on more than one provider, a relationship that becomes visible in the requests it makes. At nextdayplates.co.uk, for example, a page for customizing license plates was linked to Lovable, an AI website builder, and fetched a product listing from Shopify. Across 54,601 ranked hosts linked to Lovable under our detection rules, 1,232 (2.3%) requested data directly from Shopify, reaching 1,186 distinct Shopify addresses.
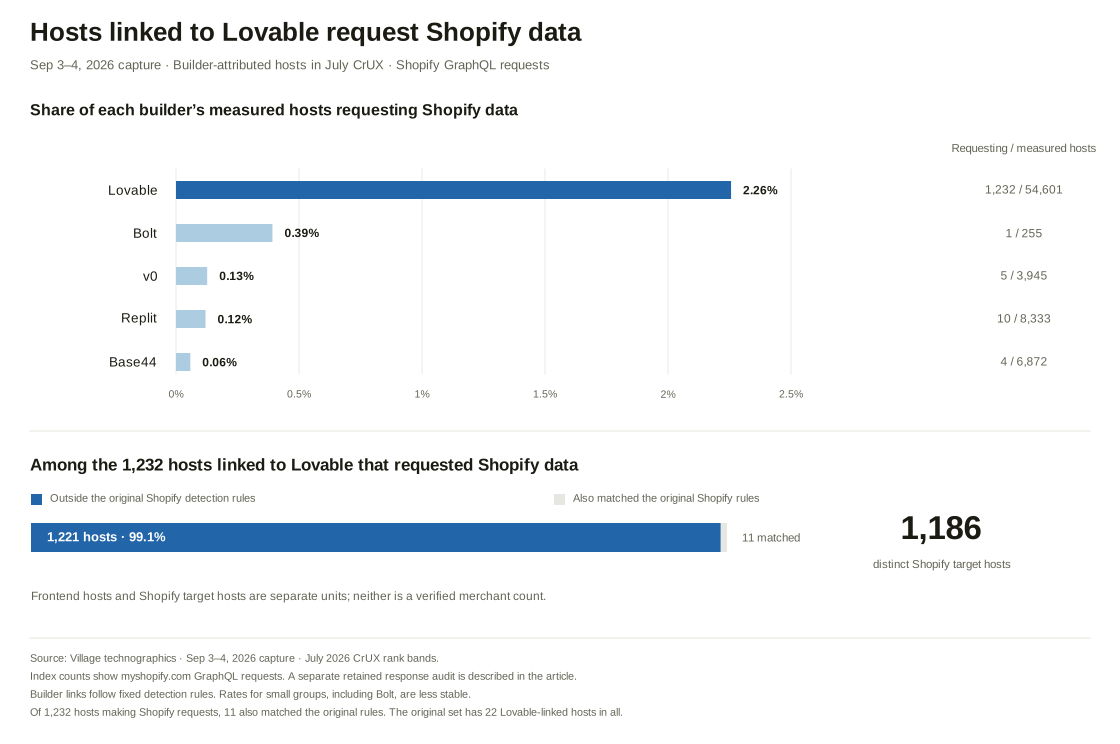
Figure 5. Hosts requesting data through Shopify’s GraphQL interface, as a share of each builder’s measured group. The lower panel shows how many of the 1,232 hosts linked to Lovable also matched the original Shopify detection rules. This analysis is separate from the site classifications.
Only 11 of those 1,232 hosts matched our original Shopify rules, while the remaining 1,221, or 99.1%, fell outside that screen. Comparing the two detection methods revealed additional Shopify connections within this group, but it does not establish a miss rate for Shopify stores across the web. The requesting and receiving addresses are also different units, so neither count establishes a number of merchants.
Village’s saved response data let us inspect what those connections supplied. Alongside the license-plate listing at nextdayplates.co.uk, calineo.in received a listing for a children’s swing rope, and pbtools.us received listings for screwdrivers and nut drivers. For all three, we linked a successful Shopify response containing product identifiers to a captured page on the requesting site. An earlier audit found product or variant data for 55 of 80 Lovable hosts; its selection and limits are described below.
Successful product responses show that the catalog connections worked, but they do not establish that a store can take orders. Lovable’s Shopify integration supports both existing stores and development stores that need further setup before accepting payments, and we did not verify sales or paid accounts.
The result is a fuller view of the software behind a storefront: a site linked to an AI builder can draw its product data from an established commerce platform, even when a platform label misses that relationship. One snapshot cannot show whether merchants switched platforms, whether adoption is growing, or how much revenue these sites generate. It gives analysts a way to examine which parts of a store different providers supply, using evidence they can trace back to individual pages and requests.
About the study. Village collected the technology evidence on September 3–4, 2026, covering 25.7m hosts, of which 22.5m had at least one browser page return a successful response or redirect. We detected platforms using clues in page code and browser requests, and assigned each host the best July CrUX band among its matching entries; a host could match several platforms.
We used gpt-5.6-sol for site classification, with targeted consistency checks. The review records are dated September 7–8, and all further checks used saved evidence without another crawl.
The category chart keeps every selected host, including unresolved cases, while the brand check grouped 94 hosts into 34 explicitly reviewed identities within the same platform and category. That check preserves separate tenants on shared hosting services and does not establish common ownership. Grouping the reviewed brands reduced Salesforce’s home and furniture category from 19 of 250 hosts (7.6%) to 11 of 220 units (5%). For Magento, the books, comics, and stationery category fell from 8 of 250 hosts (3.2%) to 3 of 232 units (1.3%).
Alongside a review of 14 ambiguous records, we used broad flags for classification, access, and platform-detection concerns to set aside 601 records, leaving 1,899 hosts. Some of these flags concern sourcing or purchase routes rather than the product category. After both the exclusion and brand grouping, apparel accounted for 47.8% of Shopify’s sample and 51.6% of Salesforce’s, while services and bookings accounted for 30.9% of Squarespace’s and 35% of GoDaddy’s. These checks show how the results respond to different choices about the sample; they are not improved estimates for all customers.
For the earlier Lovable audit, we used a fixed rule to select 80 hosts from a broader group making Shopify requests. All 80 belong to the group in Figure 5: 55 returned product or variant data, 16 made successful catalog requests without product data retained in the capture, and 9 returned catalog errors. Because this was a selected group, the examples do not estimate how often all 1,232 connections worked.
We linked sites to builders using fixed rules based on hosting addresses and builders’ own domains. All five measured groups had browser captures of their homepages, although the rules may identify some builders more completely than others. Since the analysis relies on browser captures, requests made between servers remain invisible to it.